An Editor for the Typesetting Engine: a VSCode Extension and Incremental Reflow
Every page of this blog is set by our own engine, yet until yesterday writing .tsm meant flying blind: change a line of source, refresh the browser, see what the line breaks did. This post records two things built in a single day — an incremental fast path through the engine, and a VSCode extension with a live typeset preview built on top of it. The post itself was written in that extension, which makes it a second bootstrap.
Measure First
Optimization starts with a benchmark. bench-edit.mjs synthesizes a long mixed Chinese/English document with code blocks and formulas, then simulates an editing session: mutate one paragraph, re-typeset the whole document, time it, repeat twenty-four times, take the median. The baseline was sobering — latency grows linearly with document size:
document size
before
after
7.8K chars
12 ms
4 ms
35K chars
42 ms
13 ms
87K chars
99 ms
30 ms
Phase timing exposed three surprises. First, the biggest cost was not the typesetting algorithm but replacing the page's innerHTML wholesale on the main thread — about forty-five milliseconds of DOM rebuilding for an 87K-character document. Second, line breaking and layout inside wasm cost about thirty. Third, per-word canvas measurement — the presumed heavyweight — is actually fast in Chromium. Without measuring, all three guesses would have been wrong.
Three Layers of Caching
The fast path attacks the two big items in three layers.
A resident measurer. Word widths and vertical font metrics are memoized per font at the worker level and survive across documents; the cache is invalidated whenever a new font face lands — widths measured against a fallback face become stale the moment the real face arrives. Tree-sitter highlighting tokens are cached per (language, body) the same way.
Line-break results shared across documents. The Knuth–Plass dynamic program reads nothing but block geometry — width, space width, break width, break penalty — and no text content at all. So break results can live in a process-wide cache keyed by a hash of that geometry:
// KP reads only geometry; results share across docs via an FNV keyBreakResultbreakLinesRetry(blocks, widths, params);
After a keystroke the whole document still walks the pipeline, but only the edited paragraph actually runs the DP; every other paragraph hits the cache. Engine time for the 87K document fell from thirty milliseconds to seven.
Patch only the damaged paragraphs. The typeset output is already one container per paragraph, lines absolutely positioned inside. The old and new HTML are chunked at paragraph boundaries and compared as strings; only the differing middle is swapped into the DOM — a one-paragraph edit touches one node, and the tail shifts by normal flow.
A Crash: the Lesson of Absolute Offsets
The patching machinery failed CI the day it landed. Every rendered line carries data-s/data-e source offsets (anchors — scroll sync later depends on them), and they were absolute: type one character into paragraph two and every offset in paragraph three onward shifts, all the chunk strings differ, and per-paragraph patching silently degrades into whole-page replacement. A luckily-shaped local test hid it; CI's assertion did not.
The fix makes offsets paragraph-relative: data-s counts from the paragraph's own start, and the container carries the absolute base in data-s0. Untouched paragraphs are now byte-identical across edits; when the base shifts, one attribute is rewritten on the kept node. The lesson is old-fashioned: anything you want to reuse across edits must not embed absolute coordinates in its content — the same reasoning as position-independent code.
The Extension Itself
With the engine flattened out, the VSCode extension is a thin layer:
Highlighting: semantic tokens run the exact tree-sitter grammar the engine uses for .tsm code blocks — the editor colors what the site colors, one grammar with two consumers — plus a minimal TextMate grammar for the first paint.
Live preview: VSCode webview origins cannot host a cross-origin module worker, so the preview page is served by a loopback static server inside the extension and embedded as an iframe — shell.mjs, the worker, and the wasm run verbatim, zero bundling. Keystrokes debounce into handle.update(), and the preview patches paragraph by paragraph.
Diagnostics: engine diagnostics carry byte spans and map onto squiggles in the editor.
Two-way navigation: double-click any line in the preview to jump to its source; scrolling the editor highlights the corresponding paragraph in the preview — all powered by data-s0 + data-s from the previous section.
Print: the preview drives the paged renderer straight to PDF.
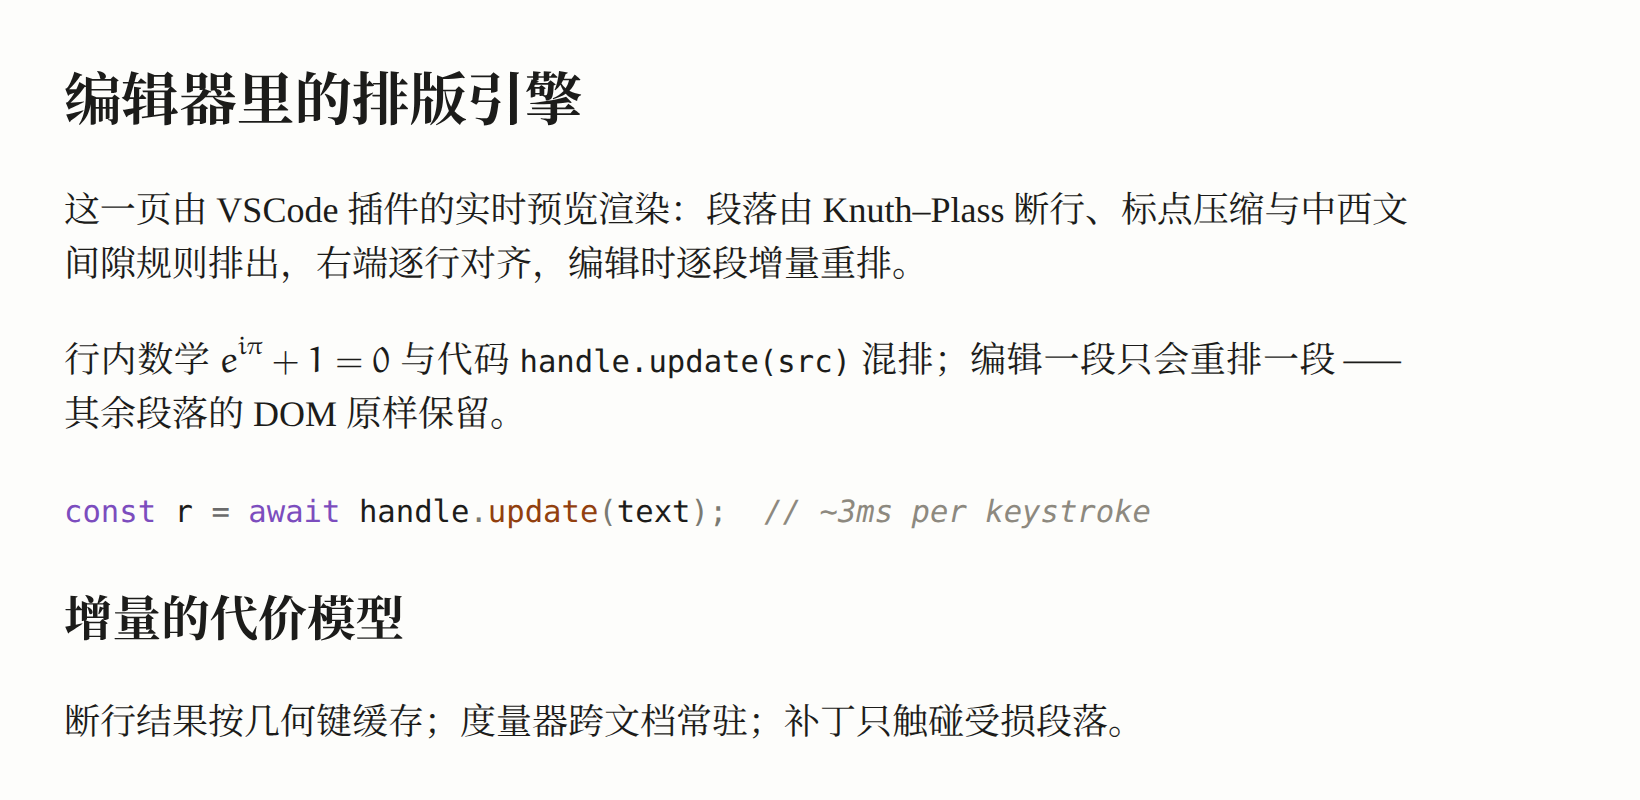
Figure 1: A document set by the extension's preview page: justification, math, code highlighting, and incremental reflow all live.
As Figure 1 shows, the preview page is just an ordinary engine host; the entire contract between extension and engine is update() plus a handful of postMessage types.
Gaps the Writing Exposed
Nothing exposes a tool's gaps faster than writing with it. From this very post:
Plotting. The performance table above would be far clearer as a latency-versus-size line chart, but the engine can only place existing bitmaps. A #!plot region — data inline in the source, vector output generated at build time, styled with the body fonts — is probably the next builder worth having.
Table column widths. The three-column table above splits the measure evenly; the numeric columns should really be narrower. Column sizing policy (by content, by weight) is still blank.
Reproducible benchmark disclosure. The numbers should carry their environment (machine, browser version); today that goes in prose. A semantic "experimental setup" block would be more dignified.
Coda
One day's output: edit latency cut to under a third, a VSCode extension with live preview, and this post. Everything shipped through the full test surface as usual — 358 goldens, 212 browser-side assertions, 199 corpus documents — and reached this page only after CI went green.